Twitter text analysis
Twitter hosts the perfect enviroment for text analysis, the icing on the cake is the rtweet package. The rtweet package provides an API to gather text data on twitter easily, it contains an option to specify the geographical location. Every tweet that has the keyword “machine learning” as a plain text or a hashtag is collected and tokenized (split up to individual words), common words such as “the”, “of” and “to” are removed since they are not useful and do not add value to the analysis.
What I had in mind was to do the analysis using tweets from Jordan, unfortunately due to the very low amount of said keyword in Jordan, United States of America was chosen.
Due to the limitations of the API, the dataset contains 7 days ranging from 12th August to 19th August 2019. The analysis is heavily influenced by Text Mining with R written by Julia Silge and David Robinson.
Word count & Sentiment analysis
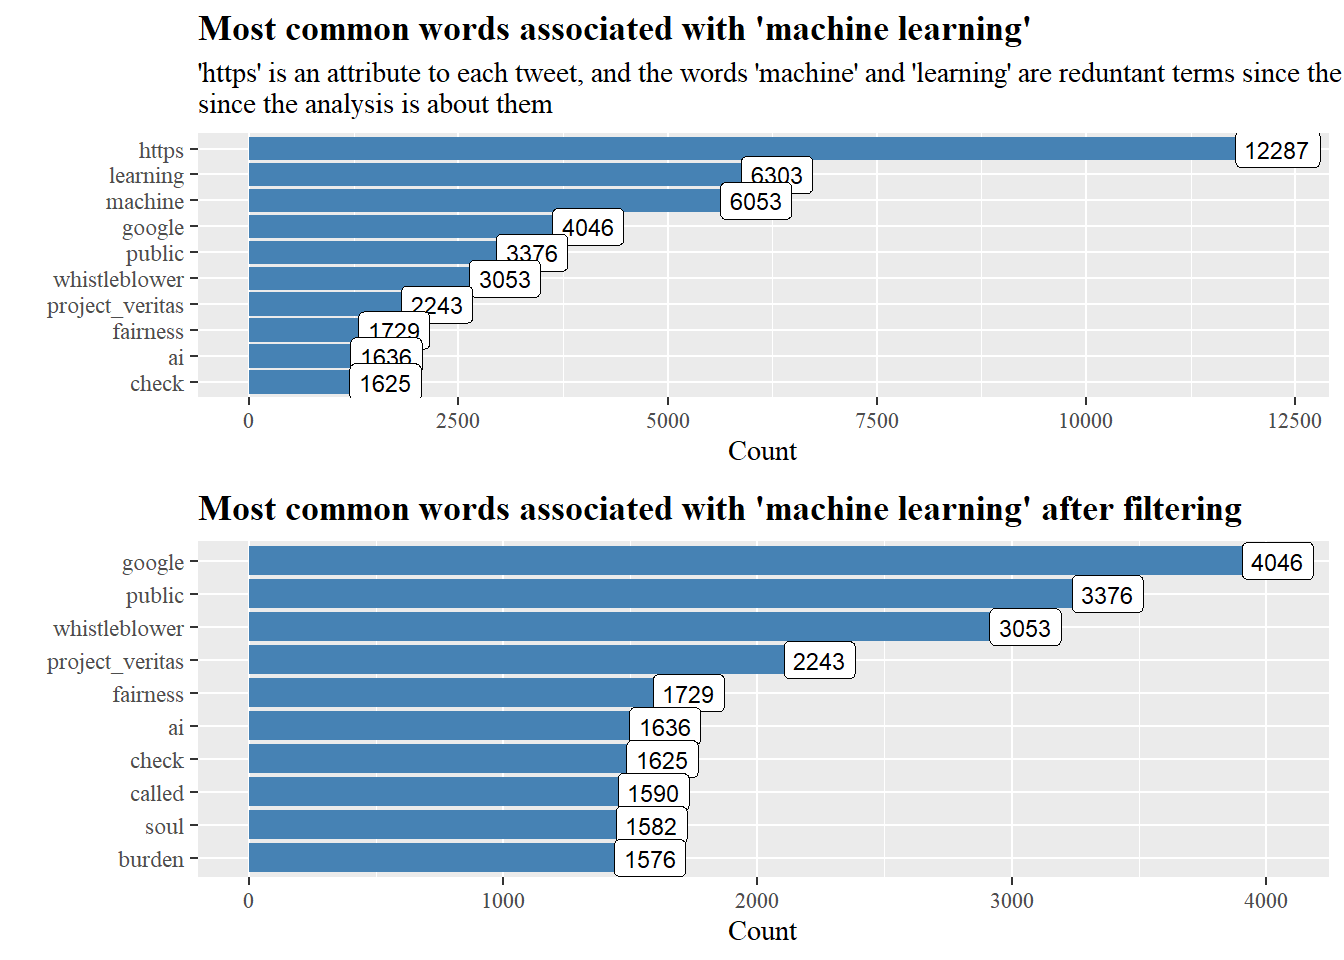
After tokenizing each tweet we can see that “https”,“learning” and “machine” have the majority counts, “https” occurs in every tweet with a linked URL and “machine” and “learning” are the subject of study, these terms are filtered out.
After filtering we can see that terms such as “fairness”,“burden” and “project_veritas” are all associated with concerns about machine learning and AI’s future trajectory.
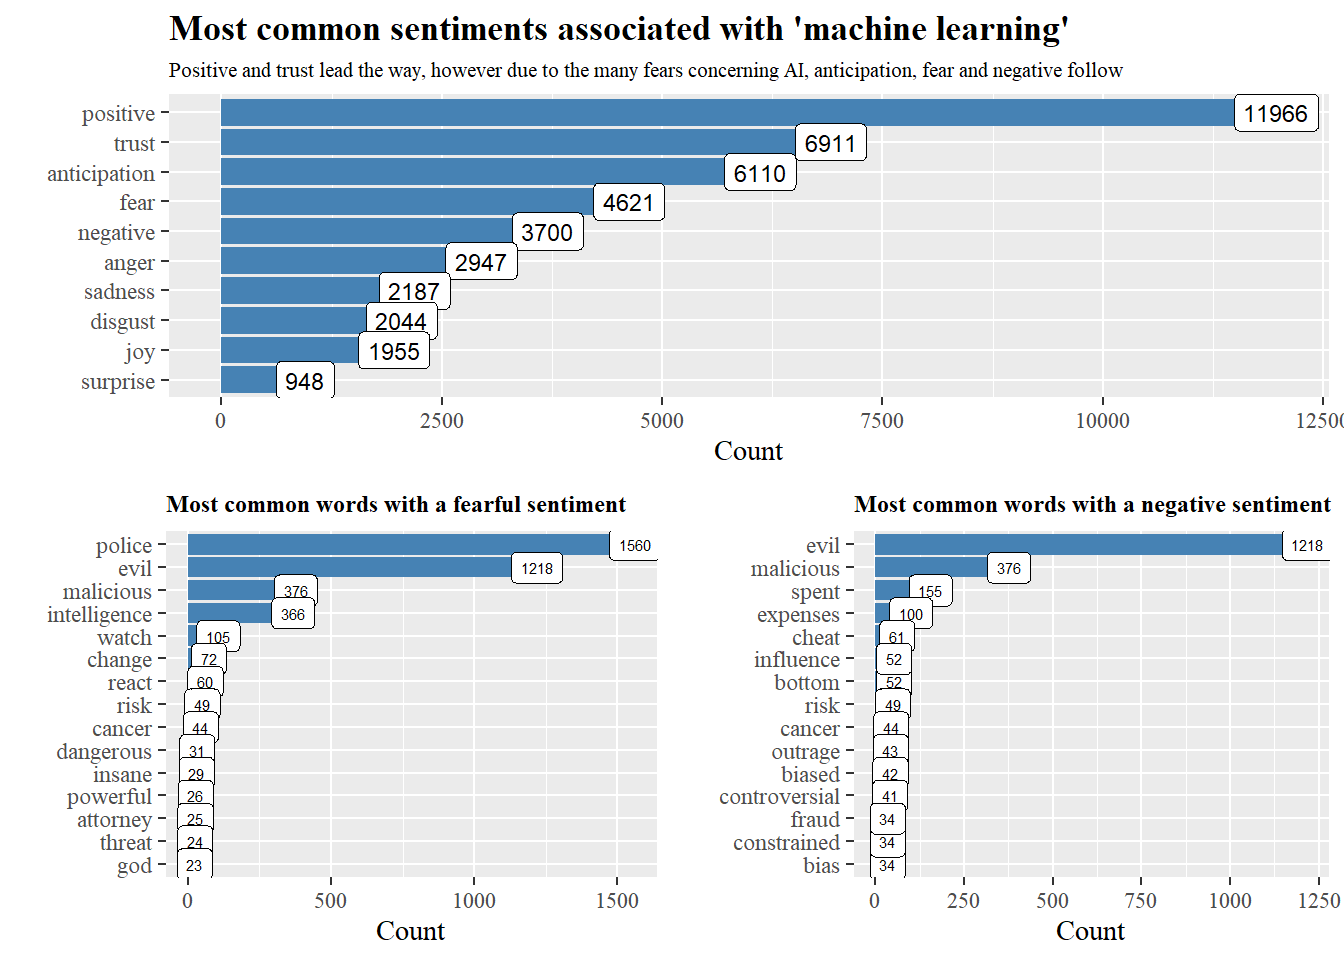
Using the NRC lexicon by Saif Mohammad, we can see the distribution of sentiments, zooming in on the “fearful” and “negative” sentiments, we can see which terms contribute most.
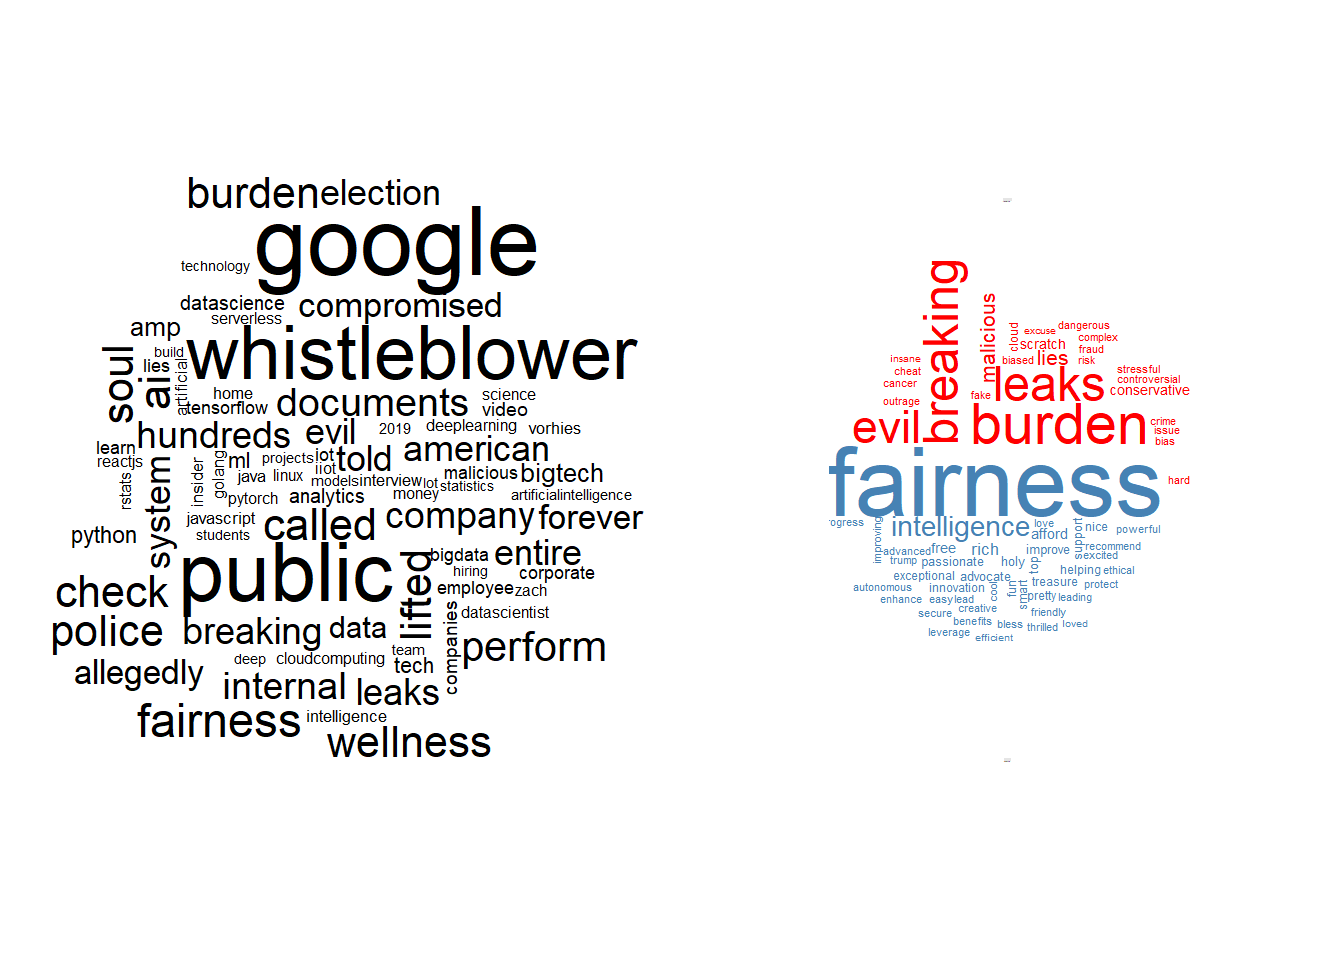
Wordclouds are always efficient in providing visual insight, the left one shows the general trend while the right one shows the positive-negative differences.
TF-IDF,network graph and topic modelling
Previously, we were focused on the terms in the per tweet level, but what about the per user level, what are the significant words per user? Here TF-IDF (term frequency-inverse document frequency) can help us.
without focusing too much behind the mathmatics, it reduces the weights of common words, while increasing the weights for rare ones. TF-IDF attempts to find the most significant words accounting for the words repetition.
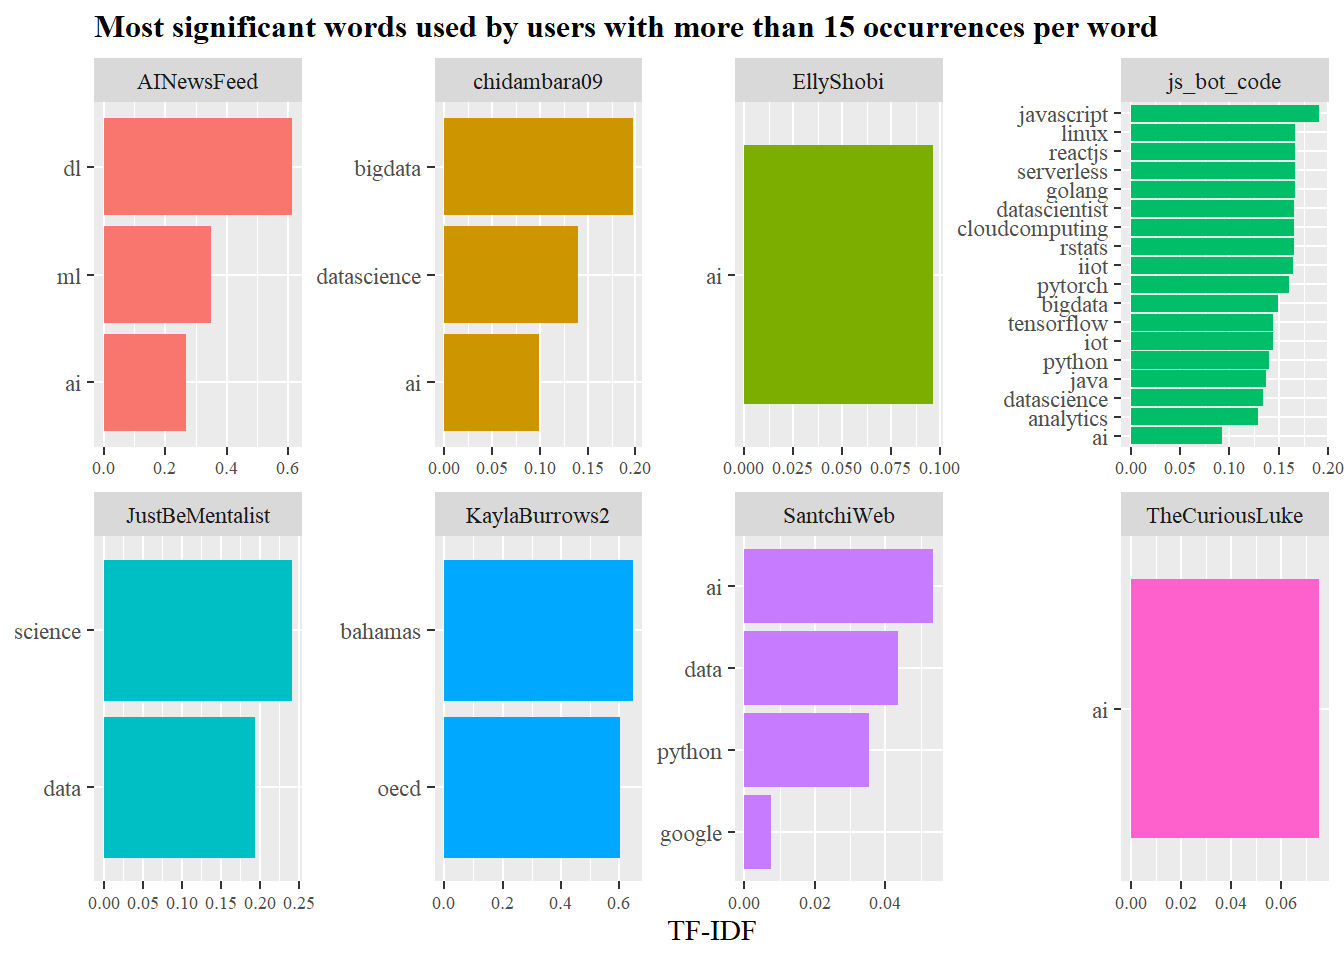
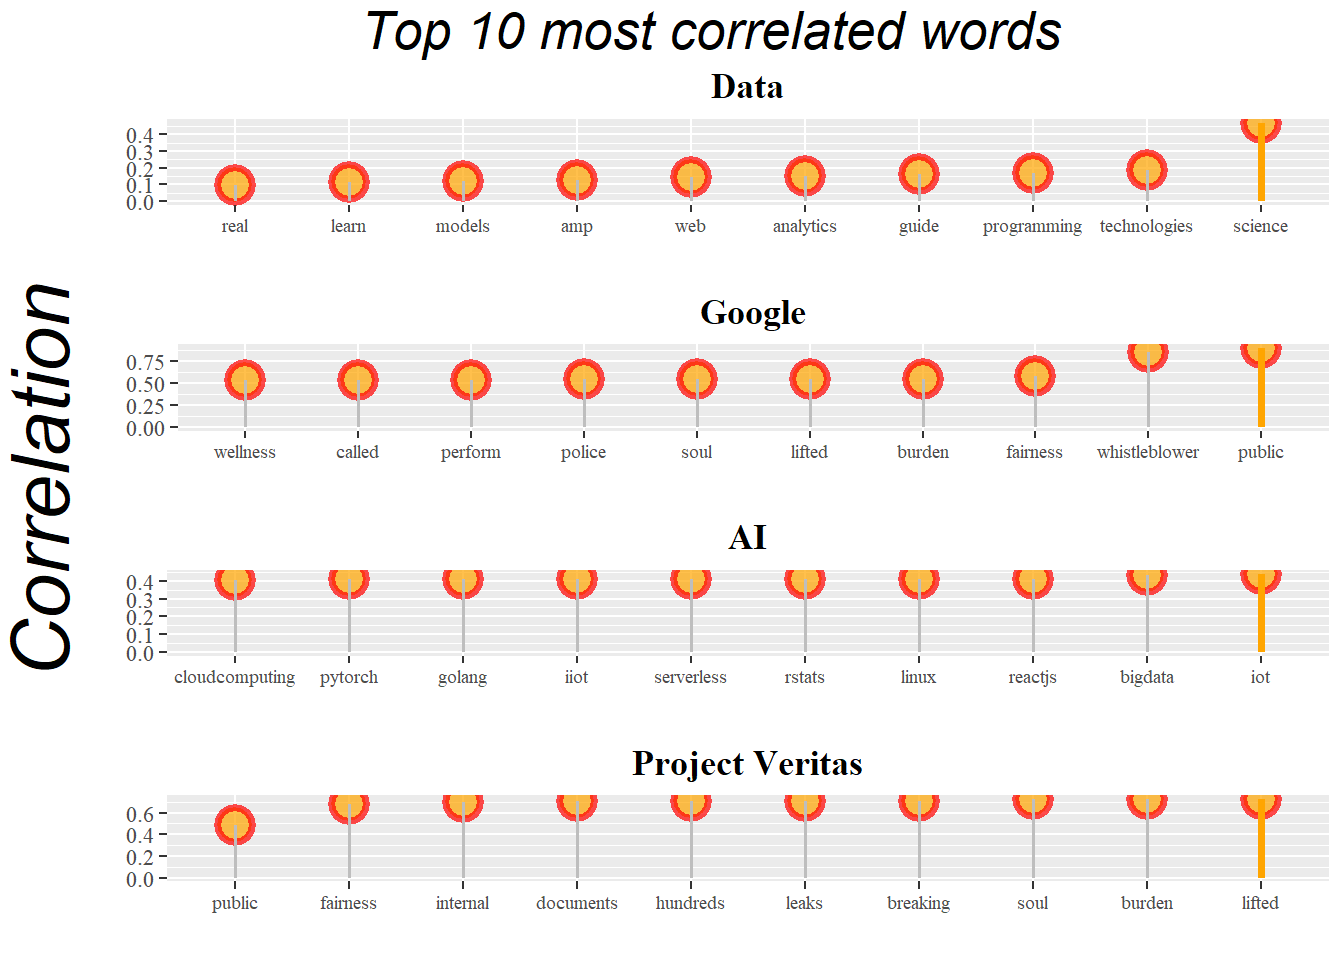
Who needs bar charts when you can have lollipops?
The following charts show the most likely word pair to occur per word, we can see “Project Veritas” words are most connected with concern sentiment about machine learning and AI.
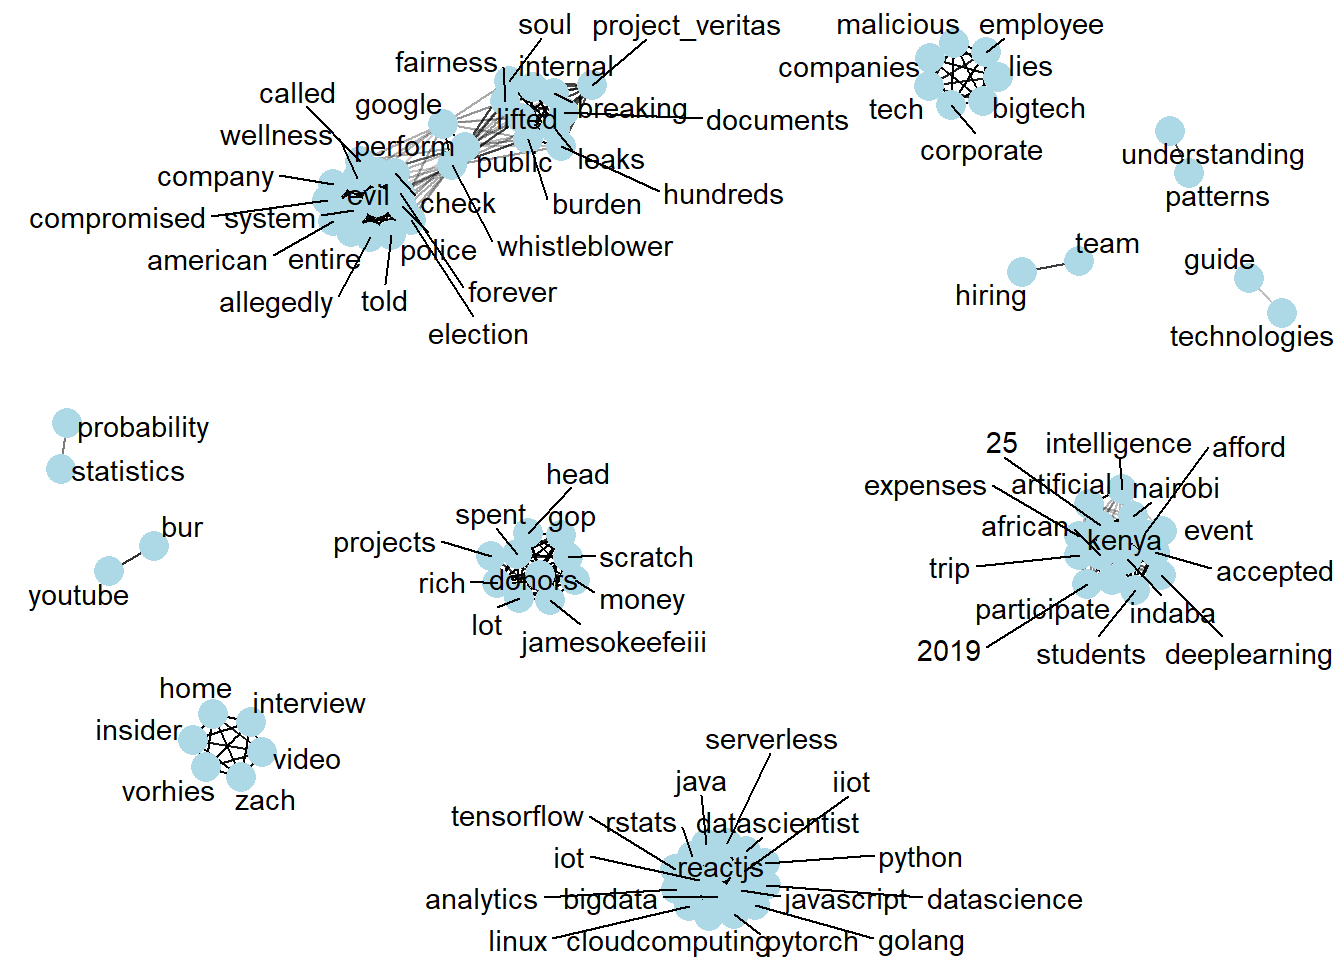
A network graph would give a clear overview of how the words are clustered, word clusters indicate that these words are most likely to be found together in a sentence.
We can see clusters that describes concern words in the top half of the network, bottom right cluster indicates a campaign sentence for a group of people in kenya that wanted to travel to a data science event, where as the bottom cluster shows technical aspects of machine learning.
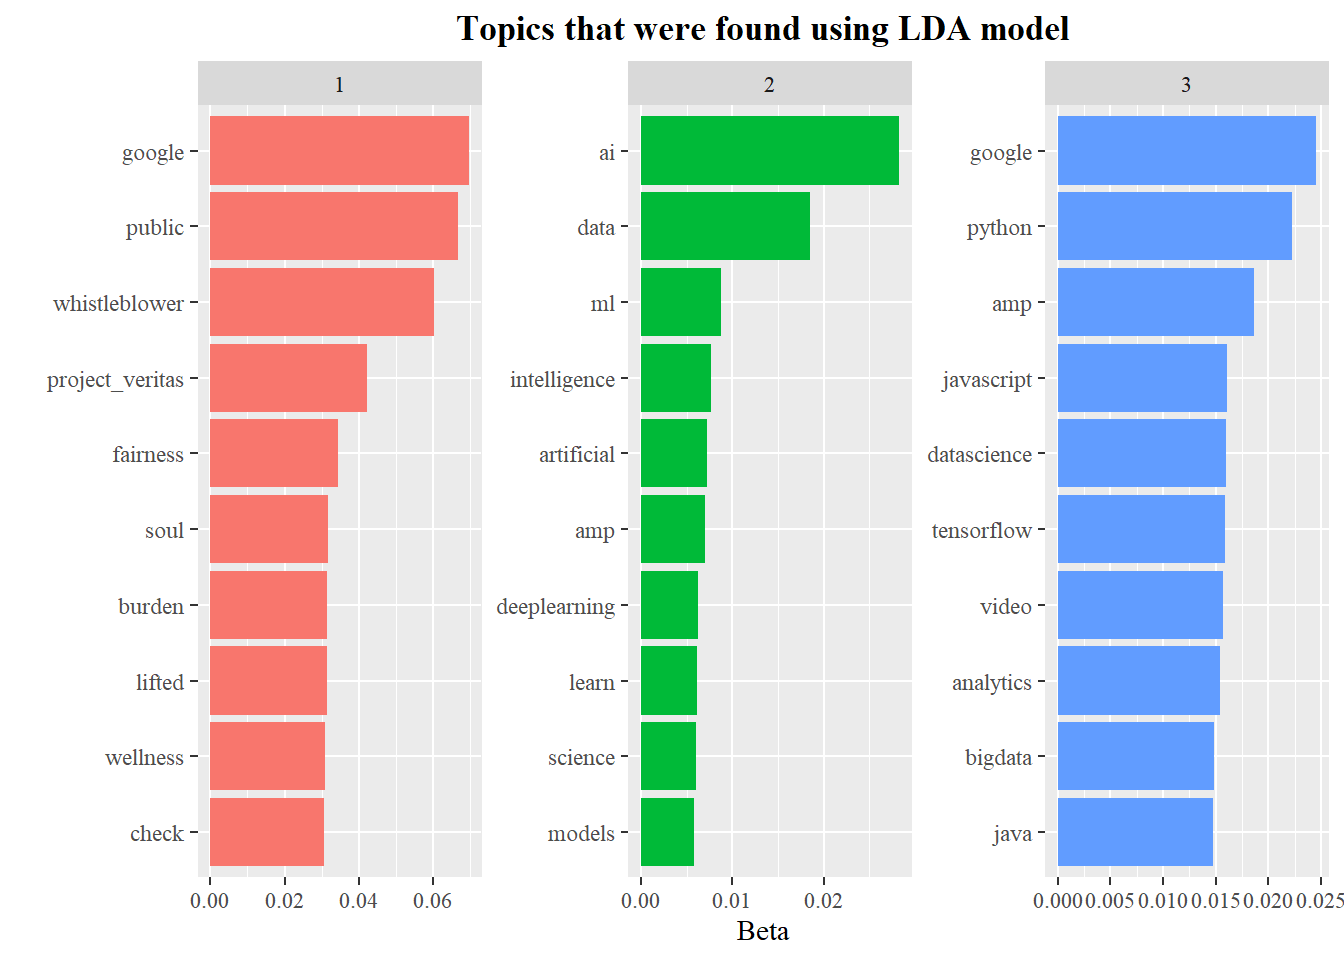
To take a deeper look into each topic, we model them using Latent Dirichlet Allocation (LDA), LDA is a clustering method similiar to K-means.
The per-topic-per-word probabilities are called “beta” from the model, while the per-document-per-topic probabilities are called “gamma”.
We can see using K = 3 (3 topics), as there were 3 main clusters that were present in the network graph. Based on the LDA algorithm topic 1 is mainly influenced by concerned words, topic 2 by general machine learning terms and topic 3 by AI influenced terms.
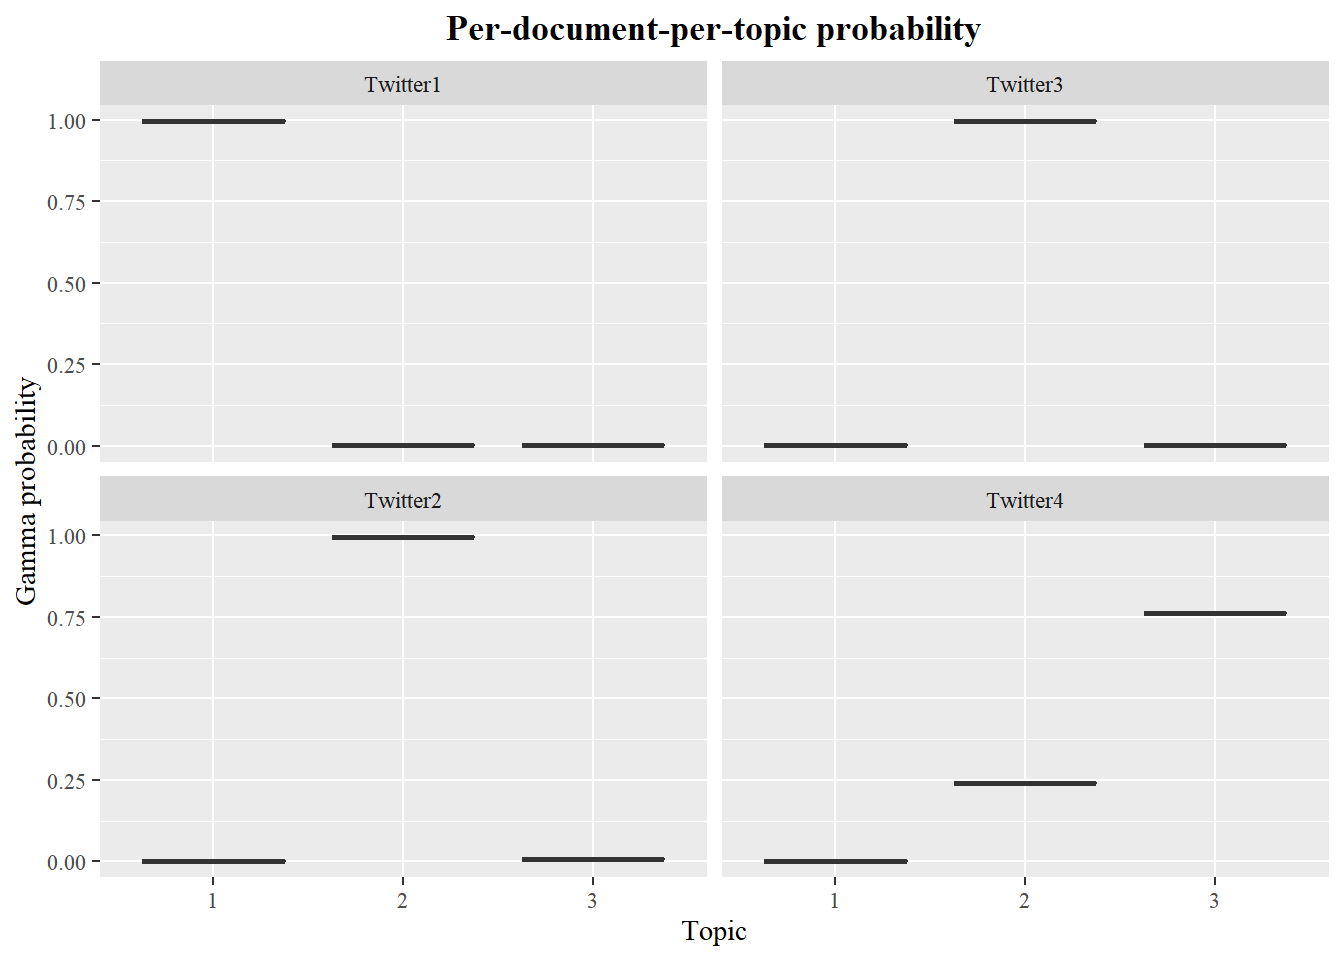
Since we already established that each twitter user is considered as a document, we can look at the per-document-per-topic probabilities. 4 Twitter users were chosen randomly to check thier probabilities, for anonymity purposes the twitter handle was replaced with “Twitter1-4”.
The model estimates that each word in tweets for Twitter1 user has around 100% probability of coming from topic 1, while Twitter4 has around 25% probability of words coming from topic 1 and a 75% probability of words coming from topic 3.